How to Prepare Bench Mark Sheet (Performance Test Results)
Bench Mark Sheet in Excel :
1.Test conducted is our server where we have conducted Performance Test
2.Conducted date is Test ran date
3.Duration: For how many hours you have conducted the Performance test
4.Users:Total thread count in Performance test
5.JDBC Conn % : It is Max active count in Context file
6.OS : In which OS your application is install
7.IsCluster: If your server is cluster then provide its details
8.Cores: It is CPU core present in your application and Data base server
9.RAM: It is total RAM present in Application and DB server
CPU and RAM Percentage
Utilization :
Steps:
1.Take vmstat file which is generated in server (vmstat 1 time >
filename.csv)(Run this command in Putty)
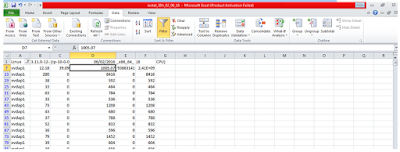
2.Open CSV file then select first
column then click on text to column option then click next
3.Select Tab and Space option then click next
4.Select general option then click next
5.Put the filter to remove all Headers except first
6.Select column who’s name is US and Plot graph for that .This column give the average utilization of
CPU
7.Copy the same sheet new sheet then delete column from “N”
to “Q”(Refer image)
8.Put the formula in “N” column [=((((32*1024*1024)-(E2+F2+G2))/1024)/1024)]
Here 32 is our size of RAM used in server
9. Put the formula in “O” column [=(N2/32)*100]
Here 32 is our size of RAM used in server
10.Select column “O” then plot a graph for that
The average of column “O” is our RAM utilization
10.DB size :
SELECT table_schema "Data Base
Name", SUM(data_length + index_length) / 1024 / 1024 "Data Base Size
in MB" FROM information_schema.TABLES WHERE table_schema = DATABASE()
GROUP BY table_schema
11.Average
Data Transfer and Band width :
Take sum of
values from View result tables then put the value in formula and
Formula : =(19139677360(Sum)/129600(time in
seconds))/1024
Band width : =(AH4*8 time in hours)/1024
TPM : =506199(Count
from view result table file refer above image)/(1024)
Read and
Write :
This can be
fetch from iostat file which is generated in server(iostat 1 time >
iostat.csv)
Follow the
same steps of vmstat file preparation
here also and put filter in first column
Column “D ”
average is Read and “E”
column is your Write (Note : Filter XVDAP1 is different for different servers
and different column for different server so filter accordingly)
To know which
is your filter type in putty : lsblk to get your disk name
Response Time: Capture all required data
from aggregate graph and paste in new sheet
Labels : Transaction name
Samples: Total number of particular transaction during test
Average : Is a Response time of particular transaction
Min: Minimum response time
Max : Maximum response time
Error% : Failure of particular transaction during test
KB/sec : Average Network utilize by particular transaction
90% line : Is best response of 90 out of 100 ,The remaining
10% is worst
Thanks For Reading My Post
Feel Free To Comment Your Queries


Comments
Post a Comment